


Cytech harnessed the Elastic Stack to build a BI tool in 6 months
This is one in an occasional series of community driven stories born out of our #ElasticStories campaign.
Cytech Mobile is a technology provider in the telecoms sector. We build our own software products around mobile messaging, marketing and payments and we offer them to our customers all around the world. Our flagship product called mCore is a cloud based software to manage Application-to-Person (A2P) SMS trafficking for companies in the wholesale as well as retail SMS messaging business. A2P means communications sent from a software or machine to a subscriber as opposed to Person-to-Person SMS, for instance marketing messages or One-Time-Passwords. We serve two types of businesses in that market.on the one hand retail, which means relatively small volumes of SMS a company would need to send to customers or partners, and on the other hand wholesale companies targeting SMS providers and aggregators who are active in both the retail and wholesale layers — which represents a way higher volume of traffic. We have more than 1 billion transactions per year through our platforms in 10 different countries. The mCore platform is composed of different add-ons including mCore Dashboards, a business intelligence tool, which we’ve based on the Elastic Stack. I will talk about the development of that product in more detail in this blog.
Searching for a business intelligence tool
Back in 2010, most of our customers didn't really take advantage of their data so they could better understand their business, find potential issues and focus on what really matters.
As all our competitors did, we tried different approaches in the past to offer a set of visualisations:
- Offer the reporting and alerting inside the messaging suite which only worked for low volume traffic.
- Use a lightweight library that can render the charts with less resources. Still, it proved not a scalable solution.
- Moving to the Amazon Cloud, we had the resources and we could elastically alter them for each of our customers. But as the bottleneck still was the database, it didn't really make any significant difference.
Have a read-only replica of the database for reporting only and that didn't interfere with the other operations of the platform. Prior to mCore Dashboard, this is the solution we had been using so far but it's been expensive to maintain, extend, not designed for free-text search and not suitable for service monitoring.
Again these approaches weren’t good enough. That's why we looked for something that could cover all the aspects of our customers' needs: search, reporting, monitoring and alerting. In 2017 we looked around and we came across Elastic. We were surprised to discover it was covering most items of our wishlist. It took us less than a week to decide that it’s worth it to give it a try as it fitted very well with our needs. First it was a platform and not a black box. We could build our visualizations on top of it, prepare and adapt our data and shape it the way it would work well with our mCore platform. The open source nature was also a key differentiator. We have used many open source projects to develop our products, and we love the philosophy behind it. We are convinced that the free access to the code makes software products more resilient and secure. We are also very familiar with the licenses and the way Elastic is developed as our development team contributes to a number of open source projects. Finally, Kibana made the difference. We could easily create charts and graphs and, although at that time it wasn’t so advanced, it was obvious to us that Kibana’s roadmap was aligned with our product’s needs.
Implementing the Elastic Stack
Messaging and payments transactions are stored in a relational database and we had to find a way to ingest them into Elasticsearch before we could search, transform and visualise them. It took our team about a week to come up with a way to do it using Logstash. As soon as we had data coming into Elasticsearch, we were sure we could pretty much cover the top 10 requirements of our new product, mCore Dashboards. The most important of them were fast, full-text search, alerting for unexpected incidents, reporting for the top-level management and of being capable of handling a great amount of data. We installed our own Elastic Stack on-premise on Amazon Cloud next to the mCore platform. But there were a couple of very important things missing. Initially, we couldn’t offer our customers user management, alerting and reporting that were then part of the Elastic subscription. The licensing cost wasn’t compatible with our pricing structure.
mCore uses a SaaS model and its customers pay a monthly or yearly fee. It wasn’t easy to convince them to pay a substantial amount of extra money for our new BI addon, mCore Dashboards. At that point in time we had a discussion with Elastic, and it was then that Elastic Cloud was launched. It was exactly what we needed. It was 100% compatible with our offering in terms of pricing model and the cost was affordable for our customers. It also included the features that were necessary for our product so we moved to Elasticsearch Service on Cloud. Our mCore platform is sending live denormalized data to Elasticsearch and our customers can login and have access to the data. They can get a high level picture about their business or dig into their data to try and answer crucial questions about efficiency and performance.
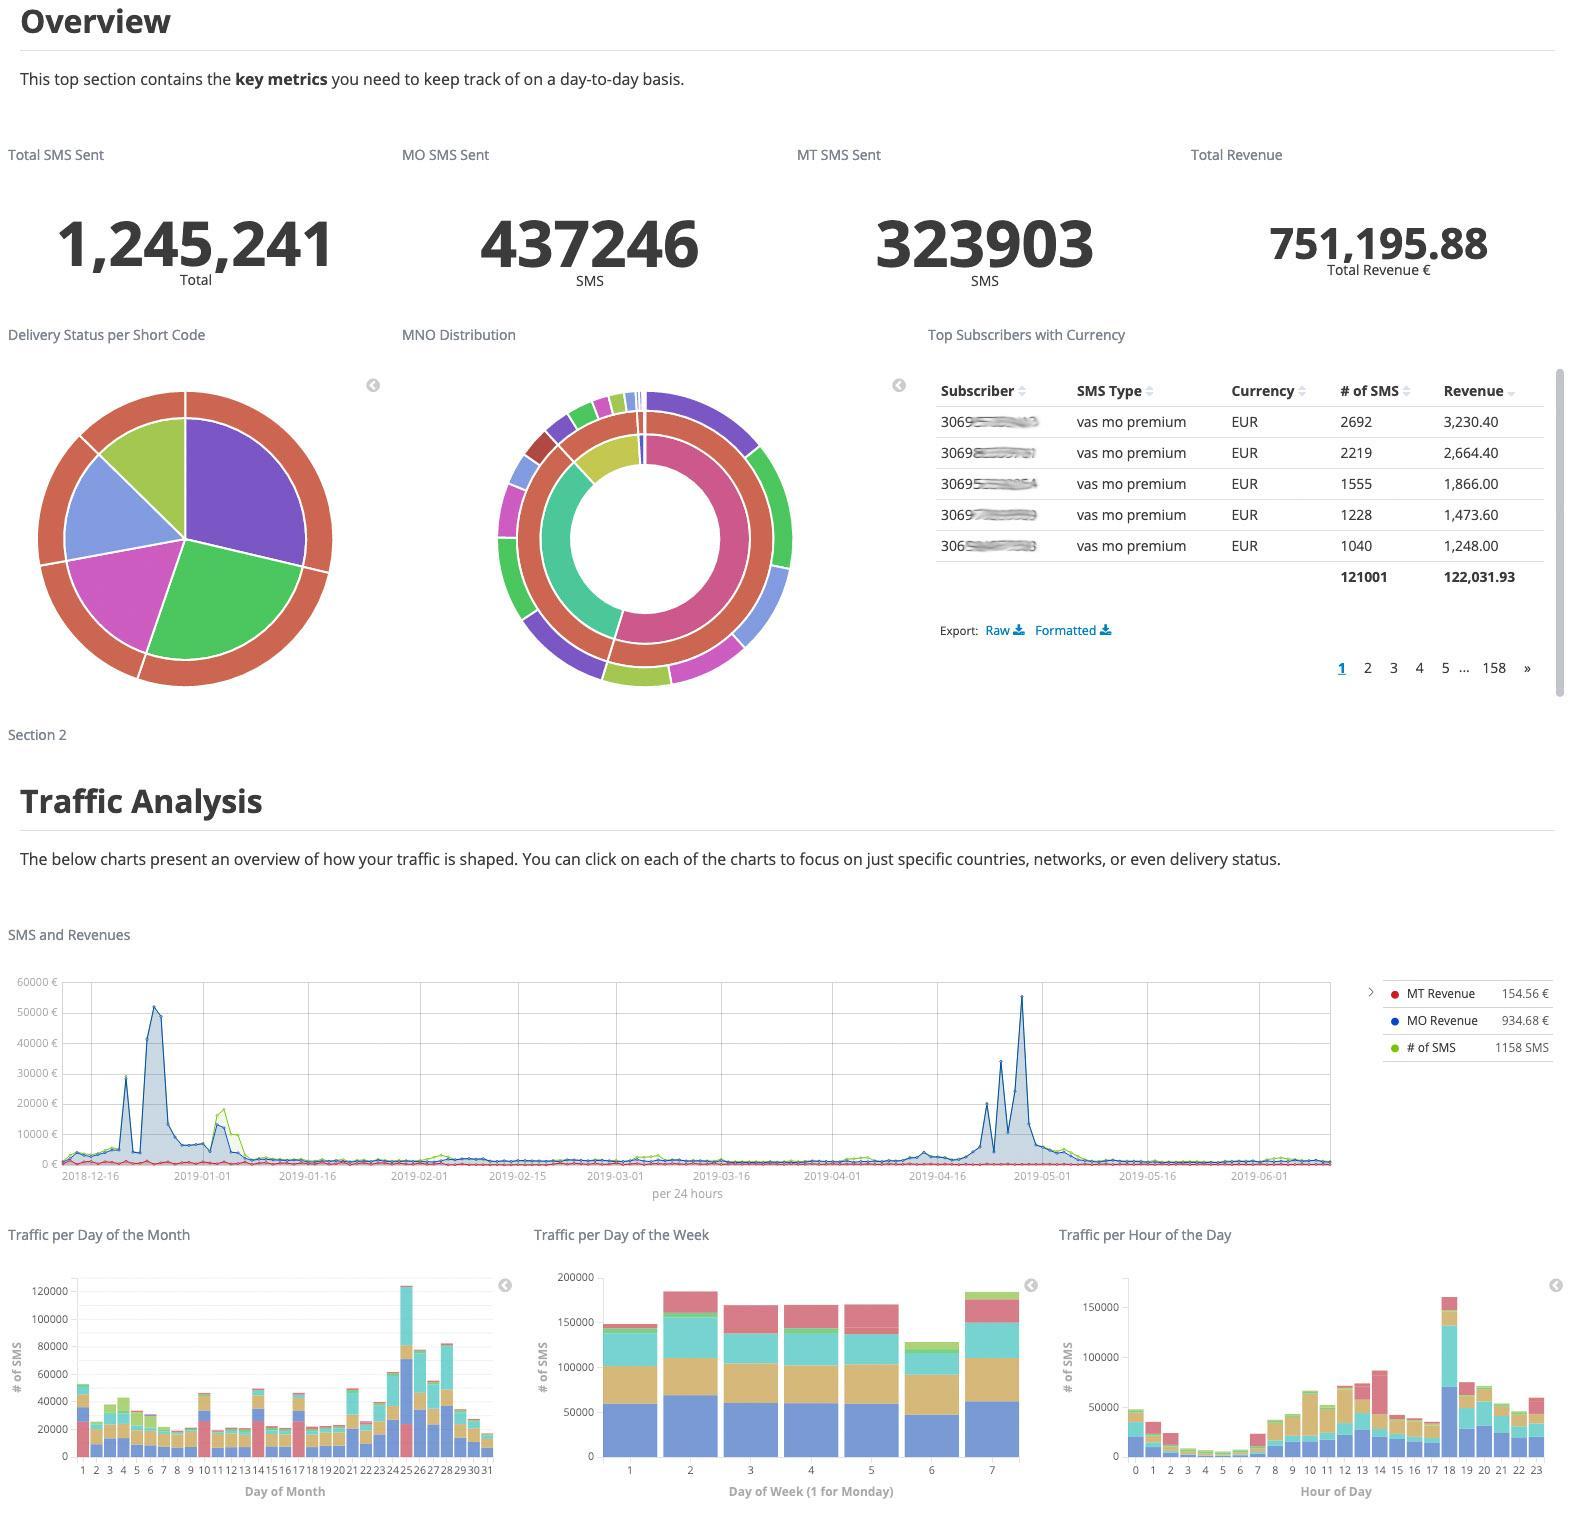
Use Cases of mCore Dashboards
For instance, they can check messaging traffic: if it is normally delivered to their partners, if and when they have peak traffic or even if they lose money. The wholesale SMS and messaging business is really complex as all the stakeholders have connections and agreements with each other and routes quality and prices are constantly changing. One of our partners who was running a Premium SMS mobile payment business had a customer who decided to charge the wrong network subscribers. The result was that our partner wasn’t making any money out of this and their revenue share fell below a certain threshold. Immediately, they received an alert from mCore Dashboards and they could investigate what happened to solve the issue. It saved them time and money and, within 20 minutes, the system was up and running again properly.
Another similar example comes from one of our partners, which is getting revenue from the network operator. They keep a small share and give the remaining amount to their customers. They need a monthly report on the amount they need to pay their customers and the amount they need to request from the network operator. Getting the monthly report used to take a whole day and involve people from different departments. Now mCore Dashboards produces and sends the report automatically every first of the month to the account managers. We received positive feedback from customers who tried mCore Dashboards which allowed them to easily get reports emailed to them and therefore save time and money. This convinced us to keep on developing mCore Dashboards. We want to install it for all our customers and make the necessary customisations and trainings so they can create their own dashboards as well as get personalized alerts and reports.
Next steps with Elastic
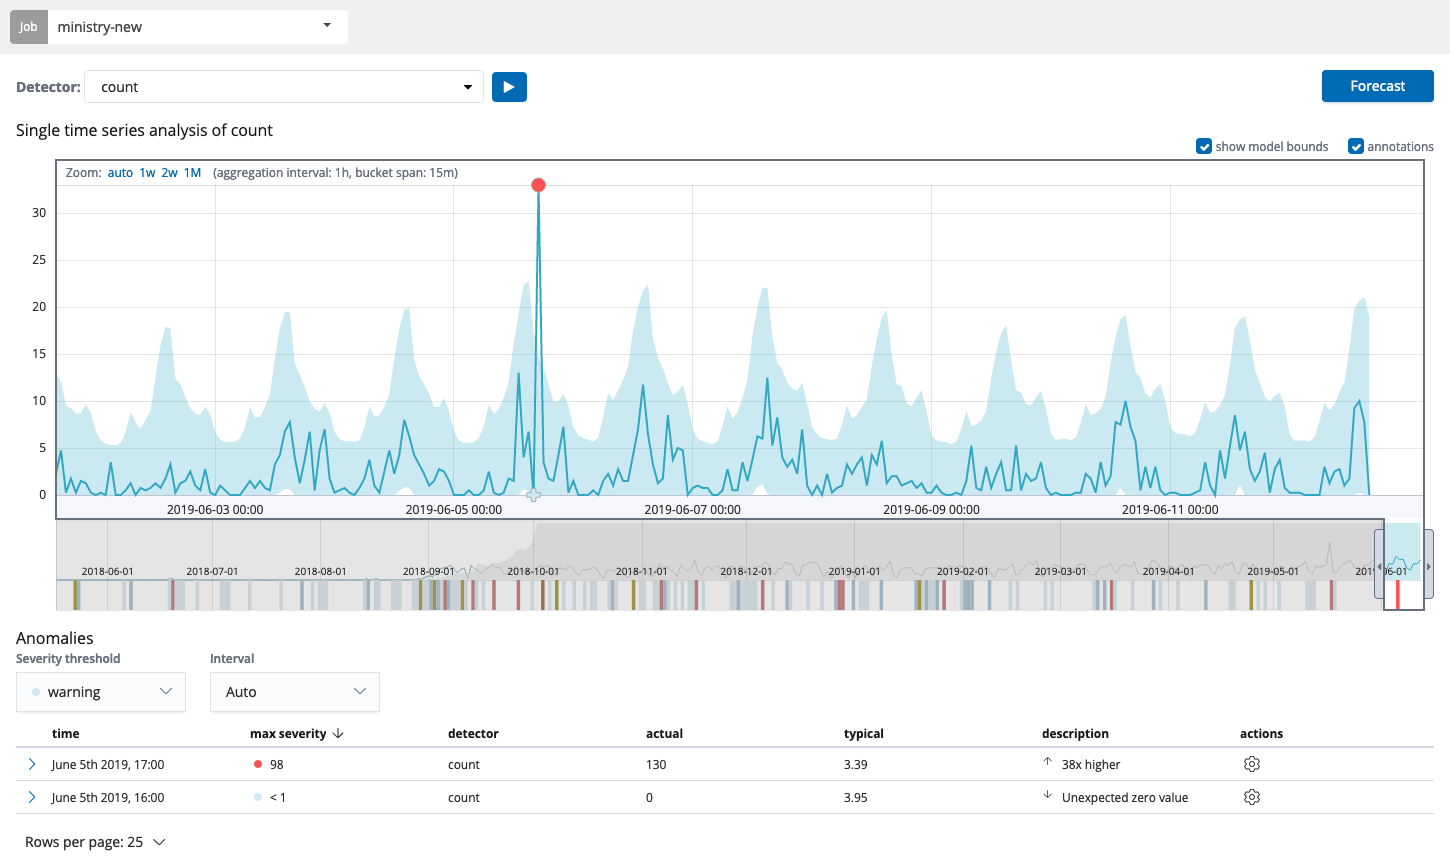
We are very interested in the machine learning feature of Elastic to discover anomalies in payments and message traffic. We are currently experimenting with it and it has pretty good results. For example, we receive alerts when the traffic grows above the normal threshold or is very low. We also receive alerts when the delivery ratio falls significantly which means that there is a potential issue with a connection or a route.
Another feature we’re quite excited about is Canvas. We are now in the process to present live infographics to our customers and get feedback. Our investment in Elastic is paying dividends as Elastic’s roadmap is well aligned with ours. Before it was Kibana and the dashboards, then Elastic Cloud and SaaS offering, and now machine learning and Canvas. Our plan is to incorporate all the features to mCore Dashboards and present a new standalone product that will be able to deal with data coming not only from mCore but from other platforms as well. We will, hopefully, present this new product at the Mobile World Congress 2020 in February. So stay tuned!

Vagelis Antoniadis is the CEO and co-founder of Cytech Mobile, a technology company in the area of mobile messaging, payments and marketing, with customers all over the world. He's responsible for driving the company’s business development and strategic business relationships worldwide. With more than 15 years experience in strategy development and solution design he strives for business innovation, applying new technologies in the mobile domain, turning them into successful products. He is also Director of Tech Talks Central, a web radio which covers all the hot topics and trends in the connected world and features interactive interviews with thought leaders of the tech industry.