Heartbeat
Lightweight shipper for uptime monitoring
Monitor services for their availability with active probing. Given a list of URLs, Heartbeat asks the simple question: Are you alive? Heartbeat ships this information and response time to the rest of the Elastic Stack for further analysis.
Easy to use. Easy to configure.
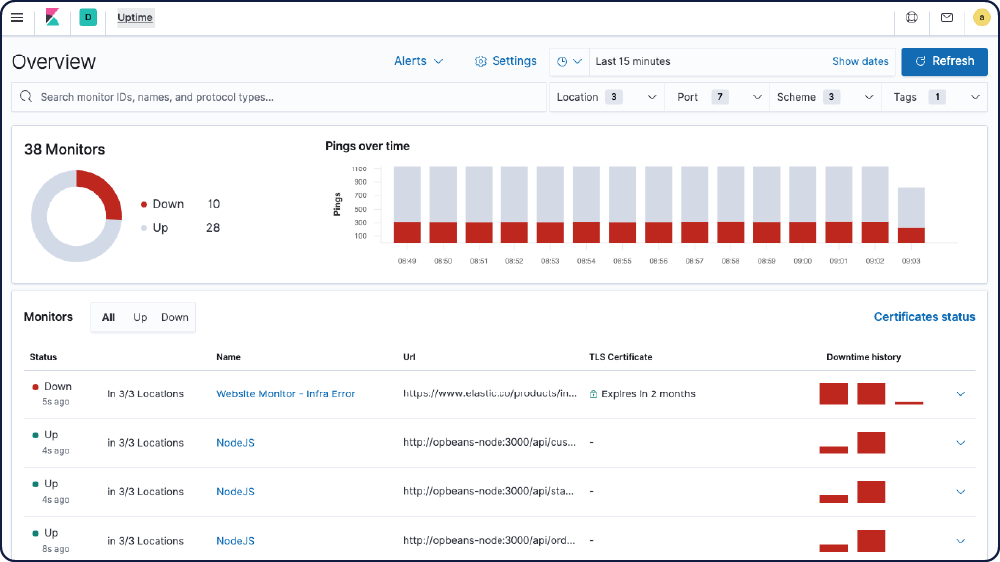
Whether you're testing a service from the same host or across the open web, Heartbeat makes it easy to generate uptime and response time data. Create your own visualizations in Kibana to track availability, or jump into Elastic Uptime (powered by Heartbeat) to monitor your apps and services via our turnkey solution.
Pings all the things
Heartbeat pings via ICMP, TCP, and HTTP, and also has support for TLS, authentication and proxies. You can monitor all the hosts behind a load-balanced server thanks to simple DNS resolution.
Dynamically add and remove targets
In today's highly dynamic infrastructures, services, and hosts go up and down all the time. Heartbeat makes it easy to automate the process of adding and removing monitoring targets via a simple, file-based interface.
It doesn't miss a beat
Spool your uptime metrics to disk so your pipeline doesn’t skip a data point — even when downstream interruptions occur. Heartbeat holds onto incoming data and then ships it all to Elasticsearch or Logstash when things are back to normal.
Ship to Elasticsearch or Logstash. Visualize in Kibana.
Heartbeat is part of the Elastic Stack, meaning it works seamlessly with Logstash, Elasticsearch, and Kibana. Whether you want to transform or enrich your metrics with Logstash, fiddle with some analytics in Elasticsearch, or build and share dashboards in Kibana, Heartbeat makes it easy to ship your data to where it matters most.