


Using Elastic Graph to Evaluate the imec.IC-link Partner Network
Editor's Note (August 3, 2021): This post uses deprecated features. Please reference the map custom regions with reverse geocoding documentation for current instructions.
In this blog, we would like to share our experiences with the Elastic Stack including the X-Pack extension used for our business analysis activities. Next to many other interesting results, we were able to deliver a unique analysis of our business partner network as a social network and quantify it by degree of separation parameter expressing interaction intensity among our partners.
Imec.IC-link – The Semiconductor Manufacturing Division at Imec
Imec is a world-leading nano-electronics R&D center, headquartered in Leuven Belgium. Currently, there are about 3,500 researchers working on a broad variety of topics, ranging from sub-10nm complementary metal-oxide-semiconductor (CMOS), wearable healthcare devices, image sensors and vision systems, solar cells, wireless communication, to gallium nitride power electronics.
The imec.IC-link division is the semiconductor manufacturing division of imec. We help innovators, entrepreneurs, and universities realize their ideas in silicon. For our customers, we enable access to leading-edge foundries for volumes ranging from small-scale Multi-Project Wafer (MPW) prototyping runs to full volume production. We also provide a wide range of related services across the entire application-specific integrated circuit (ASIC) value chain. Currently, we are serving more than 300 small and medium-sized enterprises (SMEs) and about 700 universities and every year we support the production of more than 500 integrated circuits.
Why Elastic?
During 20 years of history, we gathered a huge amount of technology and business data. It includes over three TB of technology data related to all foundry semiconductor manufacturing and related services. The latest, complex technologies further accelerate the size of datasets that need to be maintained. In addition, our business activities generate a substantial amount of data that is continuously increasing alongside a growing partner network. The standard imec infrastructure for storing, maintaining, and processing financial and CRM information is based on a robust SQL implementation and is well-suited to satisfy our requirements. However, our needs for flexible, predictive, and prescriptive analytics exploiting the merge of technology and business data is going far beyond the possibilities of the current imec infrastructure.
We decided to set up a program exploring the growing potential of our business with the help of business analytics generated by a new software infrastructure capable of processing the large amount of heterogenous data we have to maintain. Combining existing business/financial data with technology data could bring more insights and generate analysis that couldn’t be retrieved before. However, the business/financial data are supplied in the form of classical SQL tabular datasets, while technology data appears in a large variety of different forms. These include text documents, tables, presentations, even e-mail messages and many others, usually in proprietary data formats. Converting this data into some structured, tabular form would be very tedious and cumbersome and, for some of them, like free form text documents, even impossible. We had to find a way to store and search through this diverse data, which is why we built a solution based on the Elastic Stack, combining a distributed document storage with a distributed search and analytics engine. The core of our new infrastructure named imec.IC-link Business Analytics bot (BA bot) is shown below.
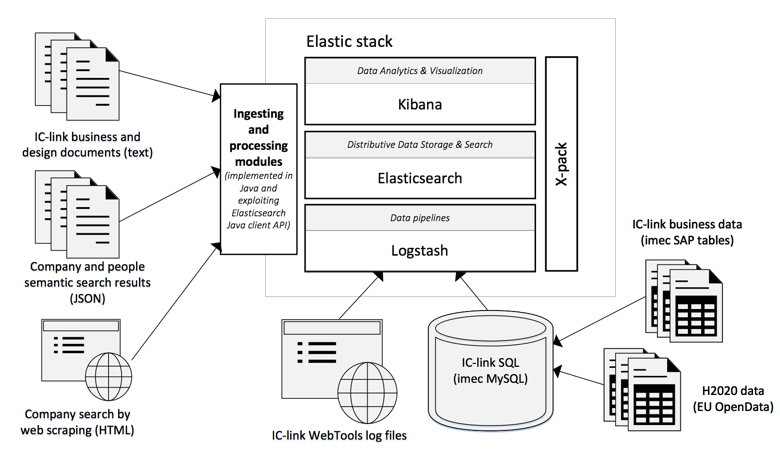
The infrastructure was designed with heterogenous data in mind. Data of various formats enter the Elastic Stack from several different sources. SQL-like datasets are first stored in an intermediate SQL storage and then transformed and sent to Elasticsearch using Logstash. Logstash is a data processing pipeline that can input, transform, and then send data to Elasticsearch. We also exploit the Logstash pipeline for inserting log data coming from our web-based toolset that helps our customers with the right technology choice for their semiconductor chip implementation. To insert business and technology documents represented as plain text, we have developed a supporting framework in Java which accesses the Elastic Stack through a Java client API.
The possibility to absorb data from external sources and merge them with imec internal data represents another important and useful aspect of our infrastructure. For instance, data about the European research framework Horizon 2020 (H2020), publicly available at the European Union Open Data Portal, represents an interesting sample where we can search for potential imec.IC-link customers from the academic and SME domains. We connected H2020 datasets through an intermediate SQL storage and Logstash, and created several useful indexes that completed the imec.IC-link customer index. Another example of a useful external data source is the company information gathered with the help of Google custom search engines and imported into the Elasticsearch cluster to complete the standard CRM info about our partners. In general, the architecture based on the Elastic Stack is easily adoptable to consume diverse external data sources. With relatively little effort, we can create merged indexes overlapping internal and external data, and thanks to Kibana we can apply interactive business analytics techniques on top of them.
X-Pack Graph Exploration and Visualization
Finally, to extend the capability of our analytics infrastructure, we decided to utilize X-Pack provided by Elastic. X-Pack is a set of commercial plug-ins which extends the functionality of the original Elastic Stack. Particularly, Elastic Graph allows us to build visualisations showing results which we wouldn’t have been able to retrieve in any other way. It enables us to discover relationships amongst documents, which in the imec.IC-link environment means discovering links between projects, customers, and so on.
Moreover, Graph works on top of existing data indices and there is no need for any kind of adaption or modification.
In this blog, we will highlight two use cases illustrating the usefulness of Graph for the purpose of better understanding our partner network and for focusing our activities towards potential customers.
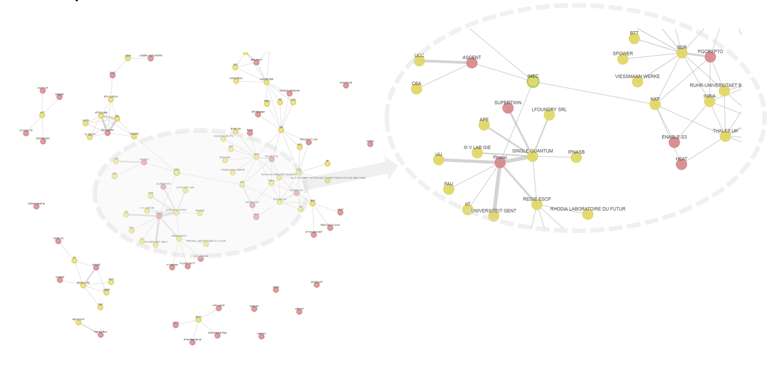
At first, we decided to analyze the network of H2020 projects and participants. We classified and clustered projects with the help of an IEEE taxonomy. Moreover, the Elastic Graph analysis enables us to distinguish between the most popular and most relevant connections. The most relevant connections are determined according to a change in relative frequency when comparing a foreground and background (all documents) set. This gave us the opportunity to identify the so-called super connected entities like research institutes and universities (which participate in hundreds of various projects) as well as local companies and institutes (which are normally “less visible” and whose activities are usually very focused and advanced).
Figure 2 shows the Graph analysis of quantum computing related projects and participants in H2020 with focus on the position of imec. We ran several H2020 Graph analyses on several selected topics (like quantum computing, neuromorphic engineering, etc.) and extracted representative dashboards, including graphs of relevant projects and participants’ connections related to an inspected topic. These dashboards happen to be very useful tools not only for imec.IC-link,but also for research teams at imec to screen potential research partners.
Imec.IC-link Partner Network Analysis
The second use case is even more important for our business development. We applied Elastic Graph features to imec.IC-link’s network of partners. This partner network consists of our academic and SME customers, and larger semiconductor manufacturers whose technology imec.IC-link makes available. Many other partners from our service and material providers that help us complete our offering along the entire ASIC value chain such as IP brokers, ASIC design houses, companies providing packaging, testing and measuring services are part of this network. Imec.IC-link brings together customers, suppliers, and semiconductor IC manufacturers and gives them a chance to work on joint projects driven by the highly experienced service teams at imec.IC-link. This way, we are creating a unique ecosystem that enables us to share experiences and continuously grow within our engineering and business development teams. Thanks to Elastic Graph, for the first time in our history, we are able to visualize our partner network and moreover compute the so-called degree of separation between customers linked within our network. Figure 3 shows the graph analysis of our network based on our business activities in 2016.
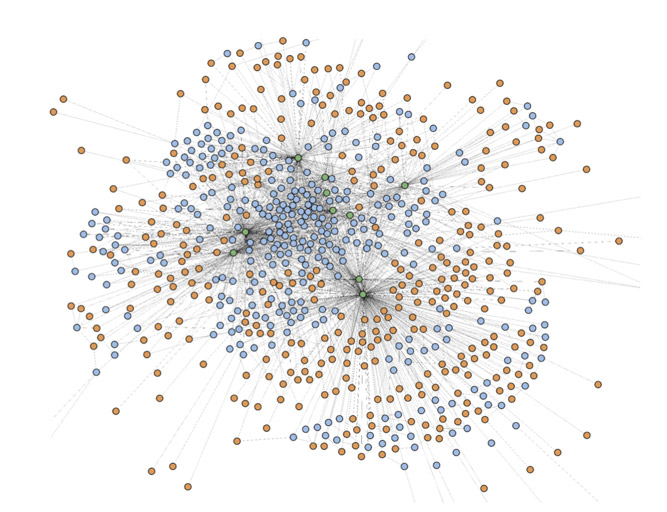
Our network of business partners covers all types of partnerships. The blue dots represent academic and SME customers the green dots represent material and service providers (including big semiconductor fabs), and the orange dots represent all projects set up by imec.IC-link in 2016. There are many different types of projects. For instance, for projects with many customers, usually academic ones, imec.IC-link integrates many designs into an MPW project for a particular technology and fab. There are also projects which involve only one or two customers, typically SME customers who already require full volume production. And finally, we are also managing unique projects, like space related projects, that require a lot of providers supplying specialized technology and services.
The principal question we asked is: what is the degree of separation between each of our customers? Or, in other words, how many hops, in average, do we need to make to connect each one of our customers to another one? Thanks to the reasonable size of our partner network, we were able to apply breadth-first graph traversal algorithm directly without the necessity to adopt any advance, probabilistic based algorithms - which are usually required in case of large scale graph results. The results, repeated for every fiscal year, confirm that the average number of hops between any two of our customers is 2.6. This relatively low number expresses high density of our partner network and at the same time it guarantees that our customers, through our engineering support teams, have easy access to a large, incrementally built experience database and all available technologies provided by our suppliers.
Conclusion
In this blog we wanted to share our great experiences with the Elastic Stack completed by X-Pack which we are using as a core building block for our business analytics infrastructure. The Elastic Stack enables the generation of classical business analytics results in an interactive and user-friendly way. Elastic Graph allows us to search for significant relations in our partner network and other related ecosystems like the European research framework H2020 without the need to build a special database structure or even rearrange data already stored in a cluster. Thanks to this graph analysis, we were able to express density of our partner network or process participant network of H2020 with a focus on particular topics.
Petr Dobrovolný | Software Engineer
Petr Dobrovolný received his M.Sc. and Ph.D. degrees from the Brno University of Technology, Dept. of Microelectronics, in 1987 and 1998, respectively. During his Ph.D. studies he investigated the problem of the symbolic analysis of large analog circuits in the cooperation with the KUL, Dept. ESAT-MICAS. Since 1999, he has been with imec, where he was involved in research and development projects focused on analysis and system level design of mixed-signal and digital electronics systems. Currently he is a member of the Business & Technology Strategy group of imec.IC-link. He is responsible for architecting and implementing business analytic framework aimed to generate various descriptive and predictive analysis results on top of internal IC-link business, operational and technology data.