使用Packetbeat来监控Cassandra
Cassandra 是一个优秀的 NOSQL 数据库,支持 kv 和列式存储,并且提供了 CQL 的类似 SQL 的查询语法。此博客主要介绍如何使用 Packetbeat 对Cassandra进行监控, Packetbeat 是 Elastic 开源的网络流量实时监控工具,目前支持了一些流行的应用软件,如 MongoDB、Redis、MySQL 等。扩展起来也是非常方便的,而 Cassandra 协议是最近刚加上去的。
Packetbeat 是一个 Golang 的程序,所以支持跨平台,没有环境依赖的问题。
使用 Packetbeat 来监控应用服务的好处就是不用对应用做任何修改。如果大家了解 APM,常见的 APM 监控探测方式一般是以应用启动的时候加载一个探针让探针来动态获取运行时信息。而走网络请求抓包的方式连服务都不用重启,更不需要修改程序一行代码。
下载地址:
https://www.elastic.co/downloads/beats/packetbeat
这里以 Mac 环境为例,下载 beat1 版本的 Mac 发行版,然后解压。
解压之后,打开配置文件:packetbeat.yml,可以看到 Cassandra 相关的配置节点。
  packetbeat.protocols.cassandra:
  #Cassandra port for traffic monitoring.
  ports: [9042]

  # If this option is enabled, the raw message of the request (`cassandra_request` field)
  # is included in published events. The default is true.
  #send_request: true

  # If this option is enabled, the raw message of the response (`cassandra_request.request_headers` field)
  # is included in published events. The default is true. enable `send_request` first before enable this option.
  #send_request_header: true

  # If this option is enabled, the raw message of the response (`cassandra_response` field)
  # is included in published events. The default is true.
  #send_response: true

  # If this option is enabled, the raw message of the response (`cassandra_response.response_headers` field)
  # is included in published events. The default is true. enable `send_response` first before enable this option.
  #send_response_header: true

  # Configures the default compression algorithm being used to uncompress compressed frames by name. Currently only `snappy` is can be configured.
  # By default no compressor is configured.
  #compressor: "snappy"

  # This option indicates which Operator/Operators will be ignored.
  #ignored_ops: ["SUPPORTED","OPTIONS"]
如果没有特殊设置,保持默认即可。如果你的程序在传输层使用了压缩,可以配置参数 compressor(目前仅支持snappy)。另外默认会使所有的请求被捕捉,并会产生大量的日志,如果有你不需要的请求类型,可以设置 ignored_ops 来添加需要过滤的操作类型。
执行命令启动 Packetbeat,注意:需要使用 sudo 来获取 root 权限进行网络抓包。
sudo ./packetbeat -e -v
如果一切正常,应该就可以看到输出了 Cassandra 模块加载的信息,如下:
packetbeat git:(master) ✗ sudo ./packetbeat -e -v
2016/09/09 06:17:16.186525 logp.go:210: INFO Metrics logging every 30s
2016/09/09 06:17:16.186129 beat.go:264: INFO Home path: [/Users/medcl/go/src/github.com/elastic/beats/packetbeat] Config path: [/Users/medcl/go/src/github.com/elastic/beats/packetbeat] Data path: [/Users/medcl/go/src/github.com/elastic/beats/packetbeat/data] Logs path: [/Users/medcl/go/src/github.com/elastic/beats/packetbeat/logs]
2016/09/09 06:17:16.186832 beat.go:174: INFO Setup Beat: packetbeat; Version: 5.0.0-alpha6
2016/09/09 06:17:16.187793 output.go:167: INFO Loading template enabled. Reading template file: /Users/medcl/go/src/github.com/elastic/beats/packetbeat/packetbeat.template.json
2016/09/09 06:17:16.192045 output.go:178: INFO Loading template enabled for Elasticsearch 2.x. Reading template file: /Users/medcl/go/src/github.com/elastic/beats/packetbeat/packetbeat.template-es2x.json
2016/09/09 06:17:16.212983 client.go:106: INFO Elasticsearch url: http://localhost:9200
2016/09/09 06:17:16.213350 outputs.go:106: INFO Activated elasticsearch as output plugin.
2016/09/09 06:17:16.213536 publish.go:301: INFO Publisher name: Medcl.local
2016/09/09 06:17:16.214095 async.go:63: INFO Flush Interval set to: 1s
2016/09/09 06:17:16.214115 async.go:64: INFO Max Bulk Size set to: 50
2016/09/09 06:17:16.214742 procs.go:91: INFO Process matching disabled
2016/09/09 06:17:16.214923 protos.go:89: INFO registered protocol plugin: http
2016/09/09 06:17:16.214940 protos.go:89: INFO registered protocol plugin: memcache
2016/09/09 06:17:16.214950 protos.go:89: INFO registered protocol plugin: mysql
2016/09/09 06:17:16.214959 protos.go:89: INFO registered protocol plugin: redis
2016/09/09 06:17:16.214969 protos.go:89: INFO registered protocol plugin: amqp
2016/09/09 06:17:16.214979 protos.go:89: INFO registered protocol plugin: cassandra
2016/09/09 06:17:16.214988 protos.go:89: INFO registered protocol plugin: nfs
2016/09/09 06:17:16.214998 protos.go:89: INFO registered protocol plugin: pgsql
2016/09/09 06:17:16.215008 protos.go:89: INFO registered protocol plugin: thrift
2016/09/09 06:17:16.215017 protos.go:89: INFO registered protocol plugin: dns
2016/09/09 06:17:16.215036 protos.go:89: INFO registered protocol plugin: mongodb
2016/09/09 06:17:16.223996 beat.go:204: INFO packetbeat start running.
Packetbeat 启动之后,我们就可以对 Cassandra 服务端发送一些测试命令来测试是否能够截获。今天演示的所有的程序都运行在 Mac 本机,所以我们这里再启动一个 Cassandra 服务端,Cassandra 解压运行就可以了。
我们使用 Cassandra 自带的命令行工具来支持 CQL 请求。
➜  cassandra-3.7 ./bin/cqlsh
Connected to Test Cluster at 127.0.0.1:9042.
[cqlsh 5.0.1 | Cassandra 3.7 | CQL spec 3.4.2 | Native protocol v4]
Use HELP for help.
cqlsh>
这里准备了几个测试命令,可以参考拷贝进去直接执行。
DROP KEYSPACE mykeyspace;

CREATE KEYSPACE mykeyspace
WITH REPLICATION = { 'class' : 'SimpleStrategy', 'replication_factor' : 1 };

USE mykeyspace;


CREATE TABLE users (
  userid int PRIMARY KEY,
    password text,
    name text,
    fname text,
    lname text,
    blog_title text,
    posted_at timestamp,
    entry_title text,
    content text,
    category int
);

INSERT INTO users (userid,  fname, lname)
  VALUES (1745, 'john', 'smith');
INSERT INTO users (userid,  fname, lname)
  VALUES (1744, 'john', 'doe');
INSERT INTO users (userid,  fname, lname)
  VALUES (1746, 'john', 'smith');

SELECT * FROM users;

CREATE INDEX ON users (lname);

SELECT * FROM users WHERE lname = 'smith';


BEGIN BATCH
  INSERT INTO users (userid, password, name) VALUES (1, 'ch@ngem3b', 'second user');
  UPDATE users SET password = 'ps22dhds' WHERE userid = 1;
  INSERT INTO users (userid, password) VALUES (2, 'ch@ngem3c');
  DELETE name FROM users WHERE userid = 2;
APPLY BATCH;


ALTER TABLE users WITH compression =
  { 'sstable_compression' : 'DeflateCompressor', 'chunk_length_kb' : 64 };


#error
CREATE INDEX ON users (lname);
USE mykeyspace_not_exists;
SELECTNOTCMD * FROM users;
最末尾还有3个错误的命令,按道理应该也是可以正确捕捉到才对。
理论上, Packetbeat 已经帮你把数据发送到 Elasticsearch 里面了,这里我们执行查询看一下。
GET packetbeat*/_search
{
  "took": 7,
  "timed_out": false,
  "_shards": {
    "total": 25,
    "successful": 25,
    "failed": 0
  },
  "hits": {
    "total": 1689677,
    "max_score": 1,
    "hits": [
      {
        "_index": "packetbeat-2016.08.25",
        "_type": "cassandra",
        "_id": "AVbCRg7vVdYPmFO6Js_q",
        "_score": 1,
        "_source": {
          "@timestamp": "2016-08-25T15:16:25.643Z",
          "beat": {
            "hostname": "Medcl.local",
            "name": "Medcl.local"
          },
          "bytes_in": 58,
          "bytes_out": 215,
          "cassandra": {
            "request": {
              "headers": {
                "flags": "Default",
                "length": 49,
                "op": "EXECUTE",
                "stream": 26752,
                "version": "4"
              }
            },
            "response": {
              "headers": {
                "flags": "Default",
                "length": 206,
                "op": "RESULT",
                "stream": 26752,
                "version": "4"
              },
              "result": {
                "rows": {
                  "meta": {
                    "col_count": 5,
                    "flags": "FLAG_5"
                  },
                  "num_rows": 1
                },
                "type": "rows"
              }
            }
          },
          "client_ip": "127.0.0.1",
          "client_port": 51295,
          "client_proc": "",
          "client_server": "Medcl.local",
          "ip": "127.0.0.1",
          "port": 9042,
          "proc": "",
          "responsetime": 0,
          "server": "Medcl.local",
          "status": "OK",
          "type": "cassandra"
        }
      }
    ]
  }
}
Packetbeat 为常见协议准备了一些 Dashboard,可以直接导入到 Kibana 里面使用。以下是 Kibana 里的 Dashboard。
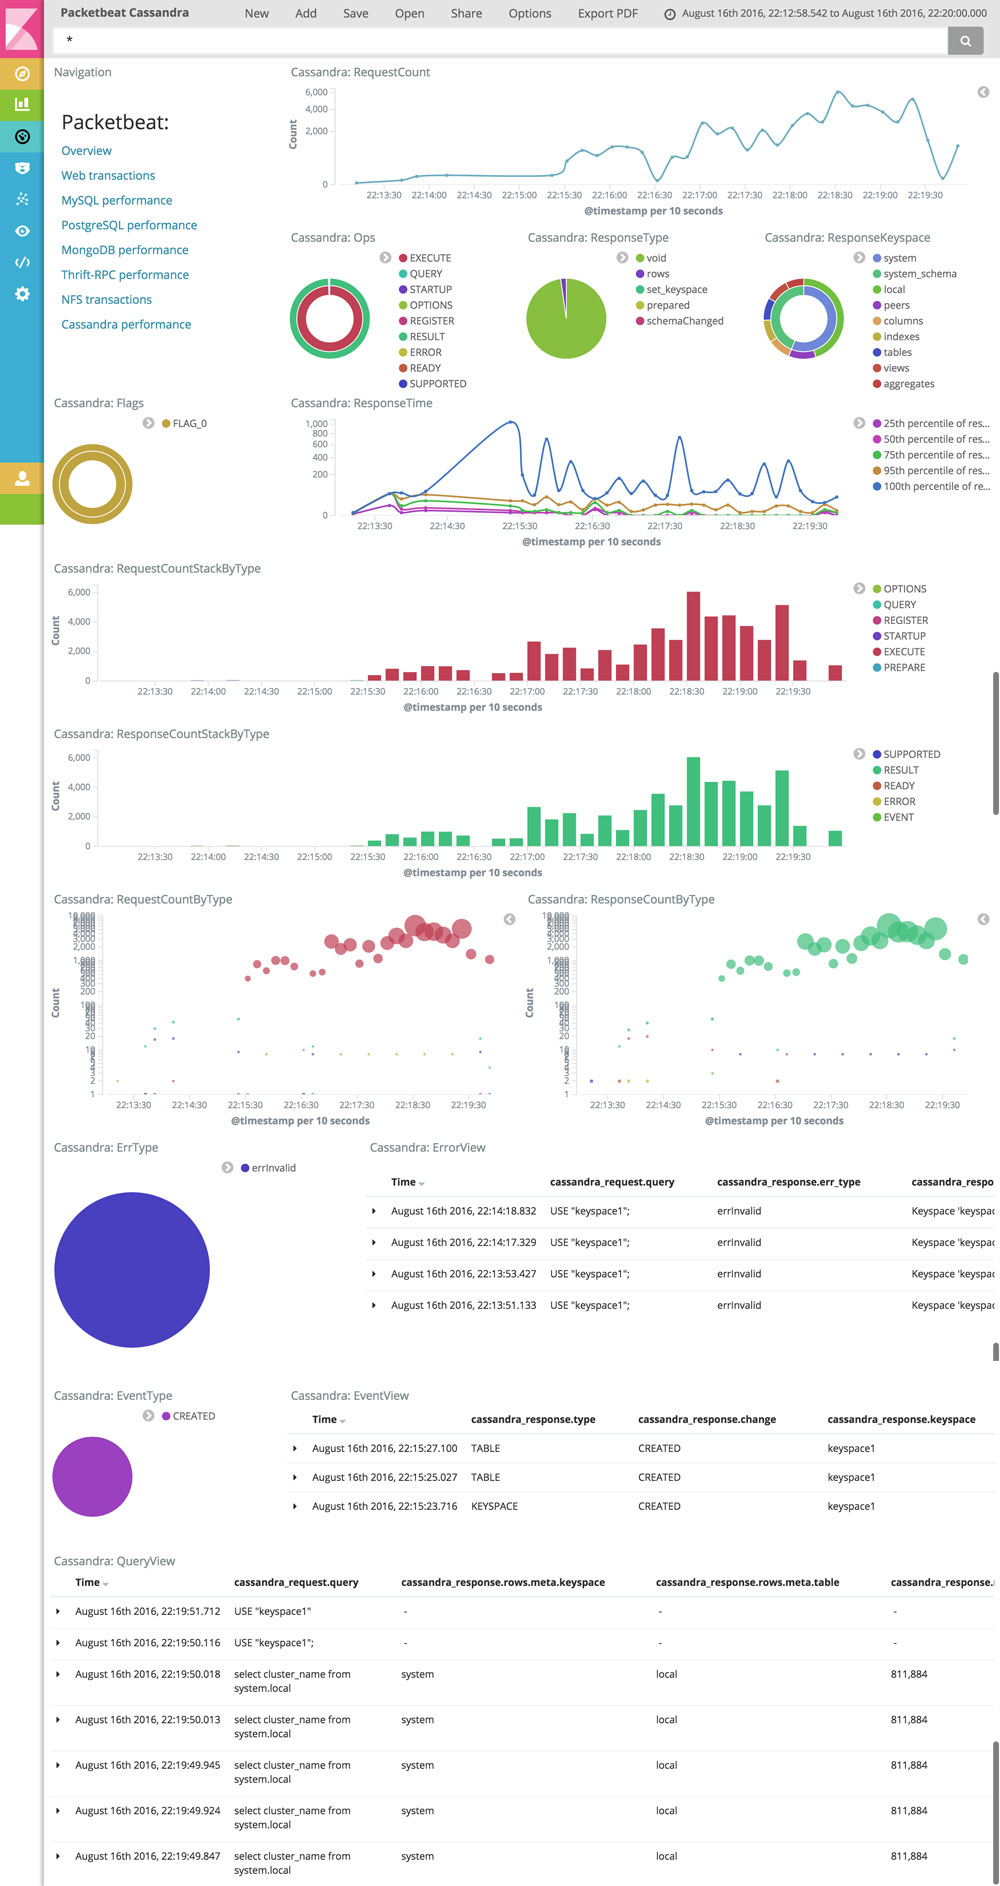
可以很方便的看到当前请求的执行情况,每秒请求数,请求类型,返回类型,keyspace 使用情况等。包括详细的错误日志和事件日志,对于分析 Cassandra 的使用情况进行性能诊断和故障分析都非常有用。